Tshr
Thyrotropin receptor (Thyroid-stimulating hormone receptor) (TSH-R)
Spatial tier: STRICT_EXCLUSIVE · Class: GPCR · Top region: ME (Median eminence) · Positive regions: 9/554
47.1Discovery Score
43.2Targetability Score
CEvidence grade C
What this means: Tshr: predicted fine-region profile is strict-exclusive, with 9 positive regions out of 554 (limit 12); direct spatial validation is required.
Function in ME: evidence, prediction, innovation
- Gene function
- Tshr encodes the thyroid-stimulating hormone receptor, a leucine-rich-repeat class-A GPCR with a large hormone-binding ectodomain. TSH binding activates Gs-cAMP-PKA and, at higher occupancy, Gq-PLC. Outside the thyroid, TSHR on hypothalamic tanycytes reads TSH released locally from the pituitary pars tuberalis.
- Region function
- The median eminence and adjacent pars tuberalis form the neurohaemal hub where tanycytes, portal capillaries and neurosecretory terminals meet; tanycytes locally convert thyroid hormone and gate GnRH and TRH access to portal blood.
- Published in this region
- direct Direct and well developed. Ono et al. 2008 (PNAS) showed long photoperiod induces pars tuberalis Tshb and that TSH acting on TSHR in the mediobasal hypothalamus/median eminence induces Dio2 and suppresses Dio3, raising local T3. Bolborea et al. 2015 (J Mol Endocrinol) showed tanycyte TSHR signals via both cAMP and Ca2+/PKC. Kameda 2023 (J Comp Neurol) documented photoperiod-dependent tanycyte and pars tuberalis changes; Rodriguez-Rodriguez et al. 2019 reviewed tanycyte control of TRH flux into portal capillaries.
- Predicted function
- Prediction: TSHR converts the melatonin-decoded photoperiod signal into intra-hypothalamic T3 by switching the tanycyte Dio2/Dio3 balance, remodelling end-feet around GnRH terminals and gating seasonality. Tanycyte-selective Tshr deletion should abolish long-day Dio2 induction and block photoperiodic gonadal activation; local TSH infusion or tanycyte Gs-DREADD activation should mimic a summer state with raised T3 and gonadal recrudescence.
- Innovation
- ★☆☆☆☆ 1/5 TSHR signalling in tanycytes of the median eminence is the textbook mechanism of mammalian photoperiodism and has been studied for nearly two decades.
- Tools
- Tshr knockout and hyt/hyt mice; floxed Tshr alleles; tanycyte drivers Rax-CreERT2 and Dio2/Gpr50 promoters with ICV AAV1; recombinant bovine TSH for ICV infusion; anti-TSHR antibodies; TSHR small-molecule agonists/antagonists.
- References
Direct evidence located at the region
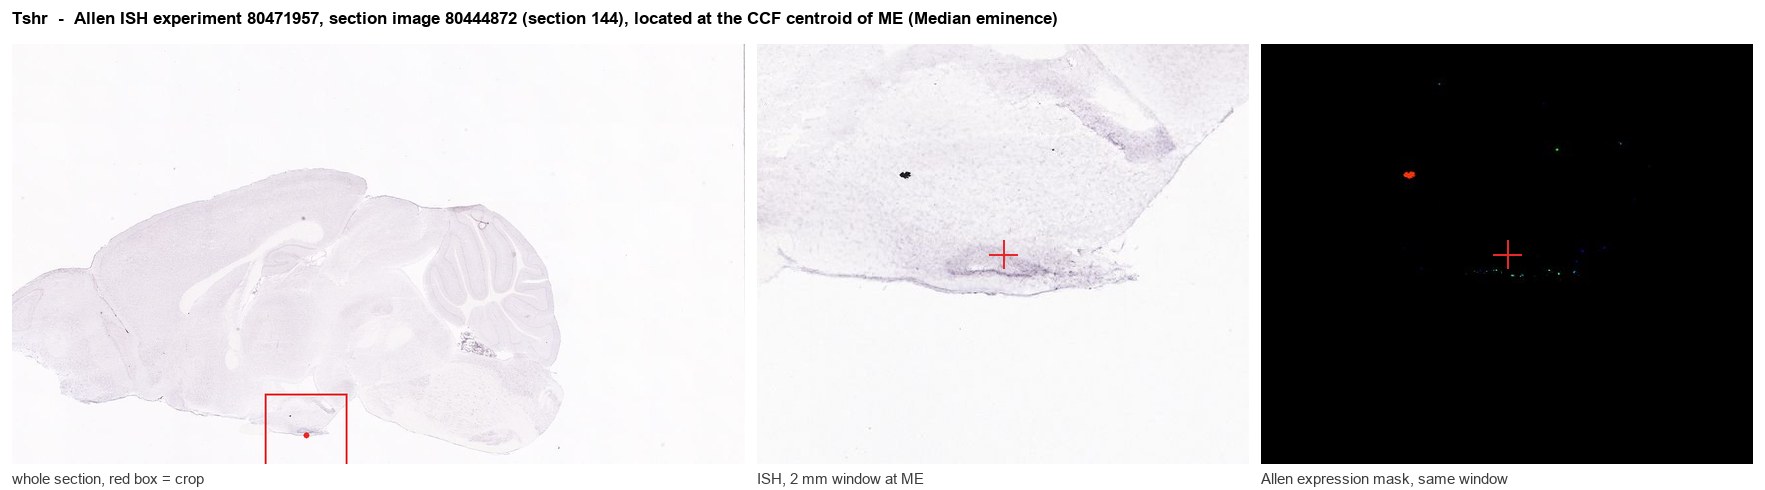
Allen ISH experiment 80471957, section image 80444872 (section 144): the section that contains the CCF centroid of Median eminence according to the Allen image-to-atlas alignment (reference_to_image), with a 2 mm window around that point. Left: whole section, red box = window. Middle: ISH signal. Right: Allen's expression-mask view of the same window. open this image in the Allen viewer
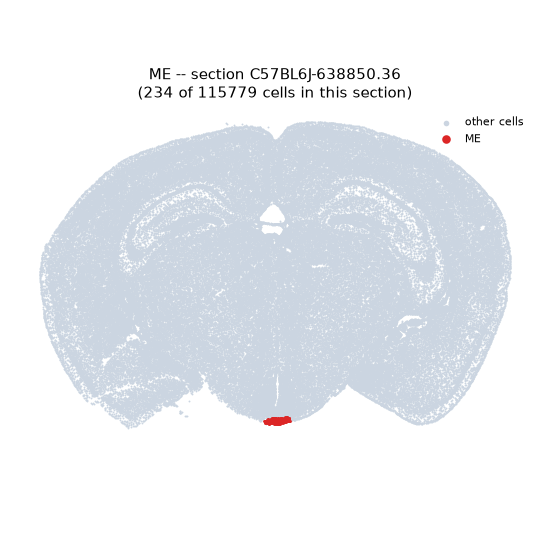
Look it up yourself: Allen Mouse Brain ISH for TshrAllen reference atlas: ME (structure 10671)ABC Atlas MERFISH viewer(in the ABC Atlas choose dataset MERFISH-C57BL6J-638850-CCF, colour cells by gene "Tshr" or by parcellation_substructure "ME")All genes confined to ME + 3-D brain
Direct spatial evidence
MERFISH REGION LOCATOR
DIRECT ALLEN ISH
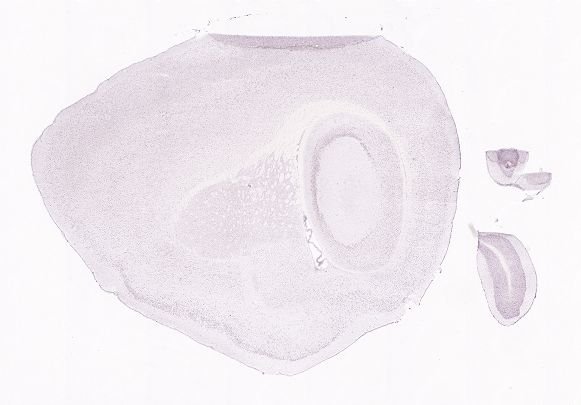
DIRECT ALLEN ISH
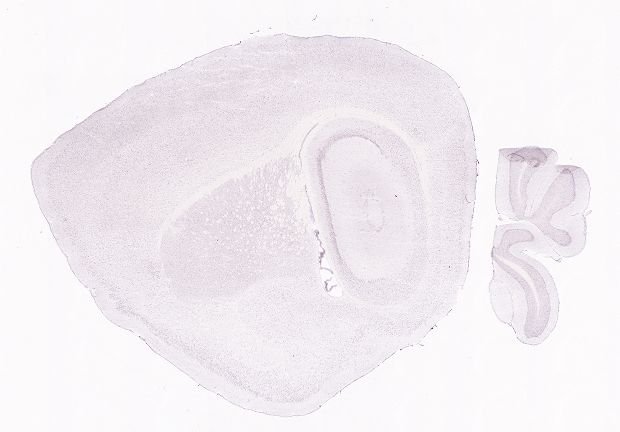
Regional expression figure
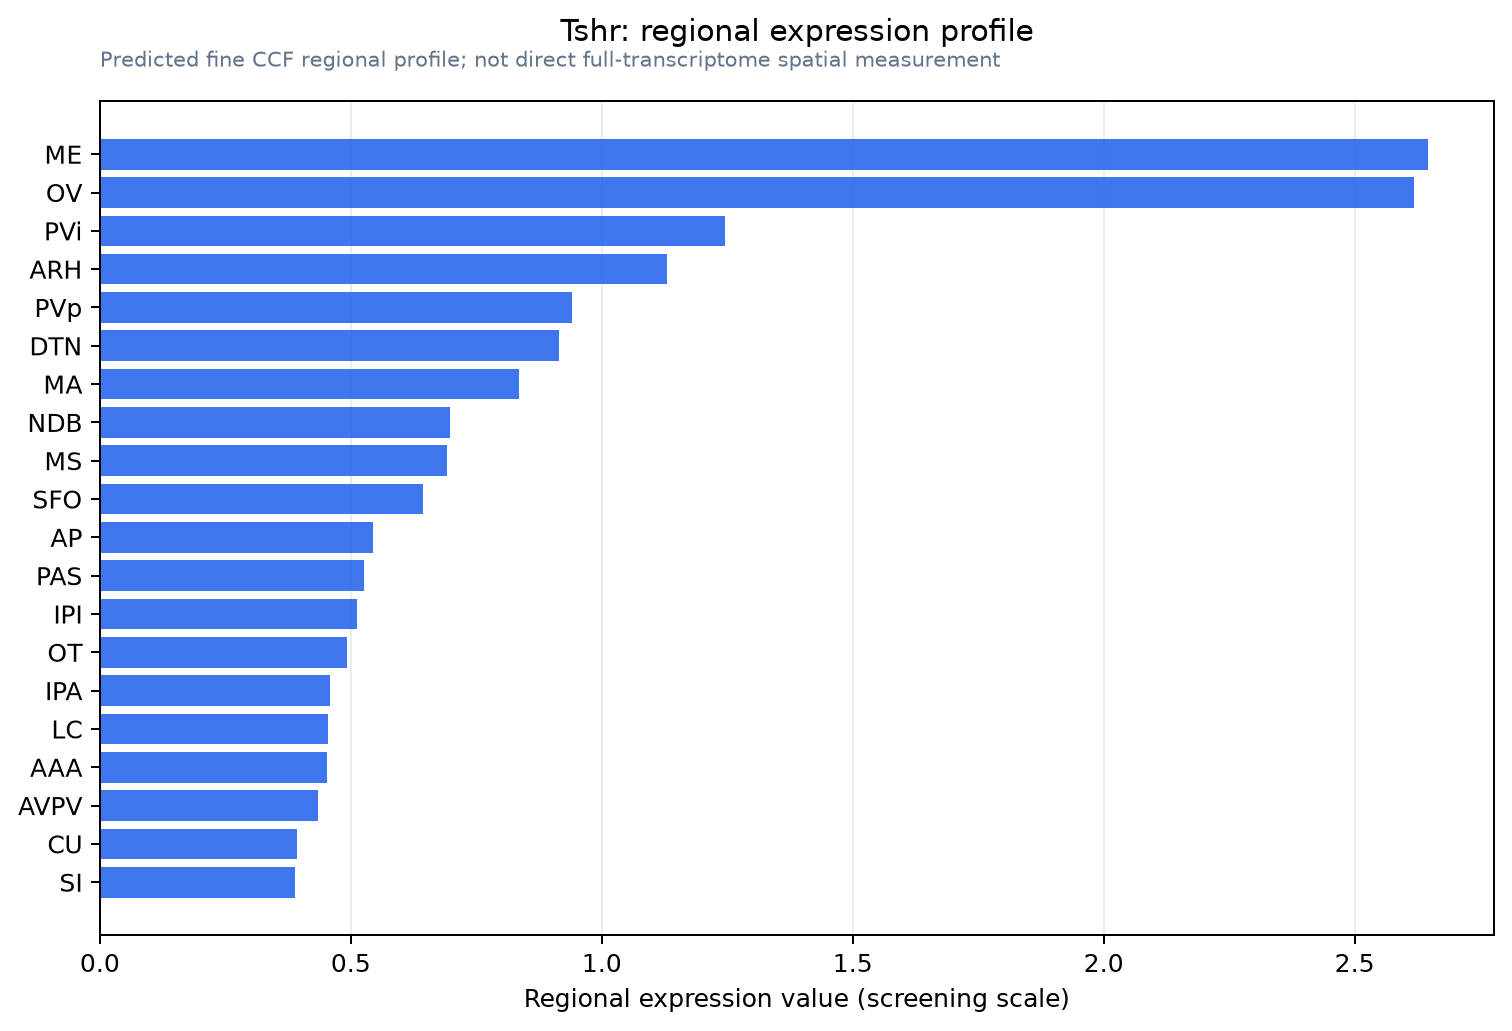
Predicted WMB × fine-CCF profile; not direct full-transcriptome spatial measurement.
Spatial profile
Evidence and specificity
- Evidence status
- PREDICTED_FINE
- Direct sources
- None; predicted localization only
- Exclusive threshold
- 12 positive regions out of 554
- Spatial specificity
- 0.387
- Top-region fraction
- 0.124
- Filter status
- PASS
Interpretation limits
- Cell-type-to-region projection is imputed expression, not direct spatial measurement.
- Adult reference atlases do not establish stability across age, sex, strain, state, or disease.
- Transcript abundance does not guarantee protein abundance or genetic-tool performance.