Htr3b
5-hydroxytryptamine receptor 3B (5-HT3-B) (5-HT3B) (Serotonin receptor 3B)
Spatial tier: STRICT_EXCLUSIVE · Class: ION_CHANNEL · Top region: ARH (Arcuate hypothalamic nucleus) · Positive regions: 1/554
48.6Discovery Score
38.5Targetability Score
CEvidence grade C
What this means: Htr3b: predicted fine-region profile is strict-exclusive, with 1 positive regions out of 554 (limit 12); direct spatial validation is required.
Function in ARH: evidence, prediction, innovation
- Gene function
- Htr3b encodes the 5-HT3B subunit of the 5-HT3 receptor, the only ionotropic serotonin receptor, a pentameric Cys-loop cation channel. 5-HT3B cannot form homomers but assembles with 5-HT3A into heteromers with much larger conductance and altered calcium permeability. Serotonin-gated opening depolarises the neuron; this receptor is the target of anti-emetic setrons.
- Region function
- The arcuate nucleus integrates blood-borne metabolic signals through AgRP/NPY, POMC, dopaminergic and GABAergic populations to control appetite, body weight and pituitary output.
- Published in this region
- expression only Lavoie et al. 2024 (Neuroendocrinology) reported that mouse ARH Htr3b is confined to the dorsal ARH and expressed almost exclusively by Crabp1-positive GABAergic neurons, a population regulated by fasting and liraglutide; no function was tested. Hisadome et al. 2009 (Neuroscience) showed ARH POMC neurons respond heterogeneously to serotonin, establishing serotonergic control of ARH but via metabotropic receptors.
- Predicted function
- Prediction: 5-HT3A/3B channels give dorsal-ARH Crabp1 GABAergic neurons a fast excitatory serotonin input alongside slow 5-HT2C actions on POMC and AgRP cells. Because these cells are GABAergic, 5-HT3 agonism (mCPBG) should increase local inhibition of POMC or AgRP neurons and shift food intake, while Htr3b deletion or ondansetron should blunt anorectic responses to serotonergic drugs. Chemogenetic activation of Htr3b/Crabp1 cells should alter feeding and possibly nausea-like avoidance.
- Innovation
- ★★★★☆ 4/5 Only a single 2024 paper reports Htr3b in the ARH and nobody has tested what this fast serotonin channel does in a nucleus otherwise dominated by metabotropic 5-HT receptor work.
- Tools
- Htr3b knockout mice, Htr3a-EGFP (GENSAT) and Htr3a-Cre lines for the obligatory partner subunit, antagonists ondansetron/granisetron/tropisetron, agonist mCPBG, Crabp1 as an intersectional marker for the ARH population.
- References
Direct evidence located at the region
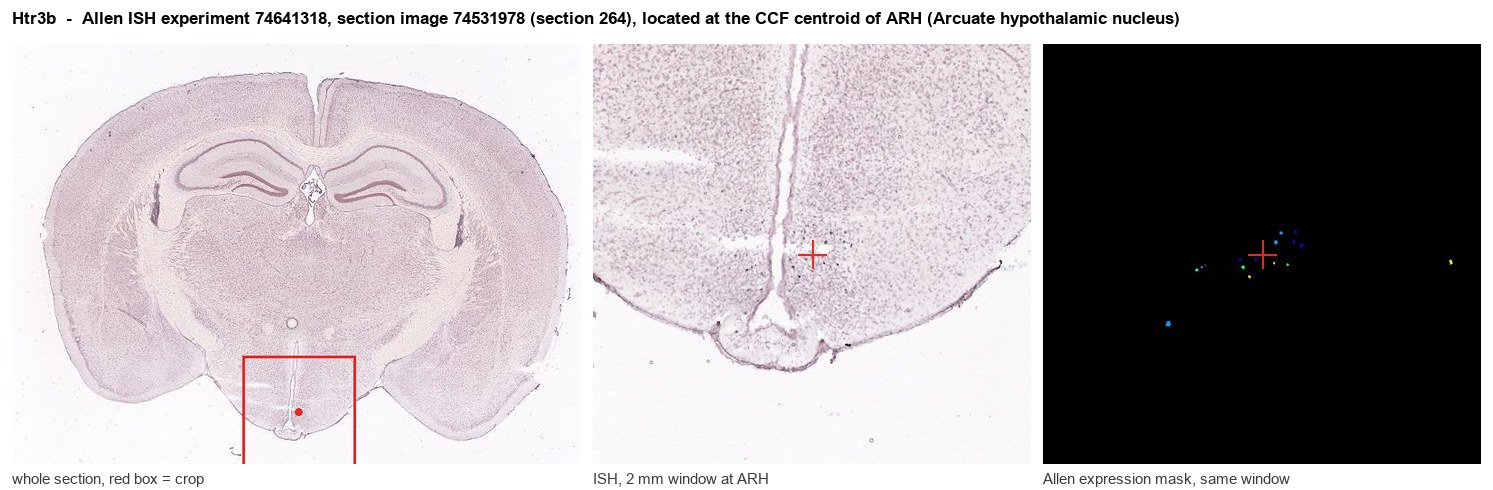
Allen ISH experiment 74641318, section image 74531978 (section 264): the section that contains the CCF centroid of Arcuate hypothalamic nucleus according to the Allen image-to-atlas alignment (reference_to_image), with a 2 mm window around that point. Left: whole section, red box = window. Middle: ISH signal. Right: Allen's expression-mask view of the same window. open this image in the Allen viewer
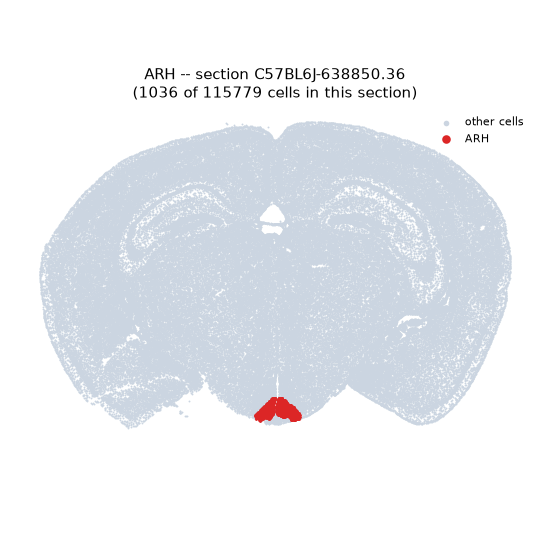
Look it up yourself: Allen Mouse Brain ISH for Htr3bAllen reference atlas: ARH (structure 223)ABC Atlas MERFISH viewer(in the ABC Atlas choose dataset MERFISH-C57BL6J-638850-CCF, colour cells by gene "Htr3b" or by parcellation_substructure "ARH")All genes confined to ARH + 3-D brain
Direct spatial evidence
MERFISH REGION LOCATOR
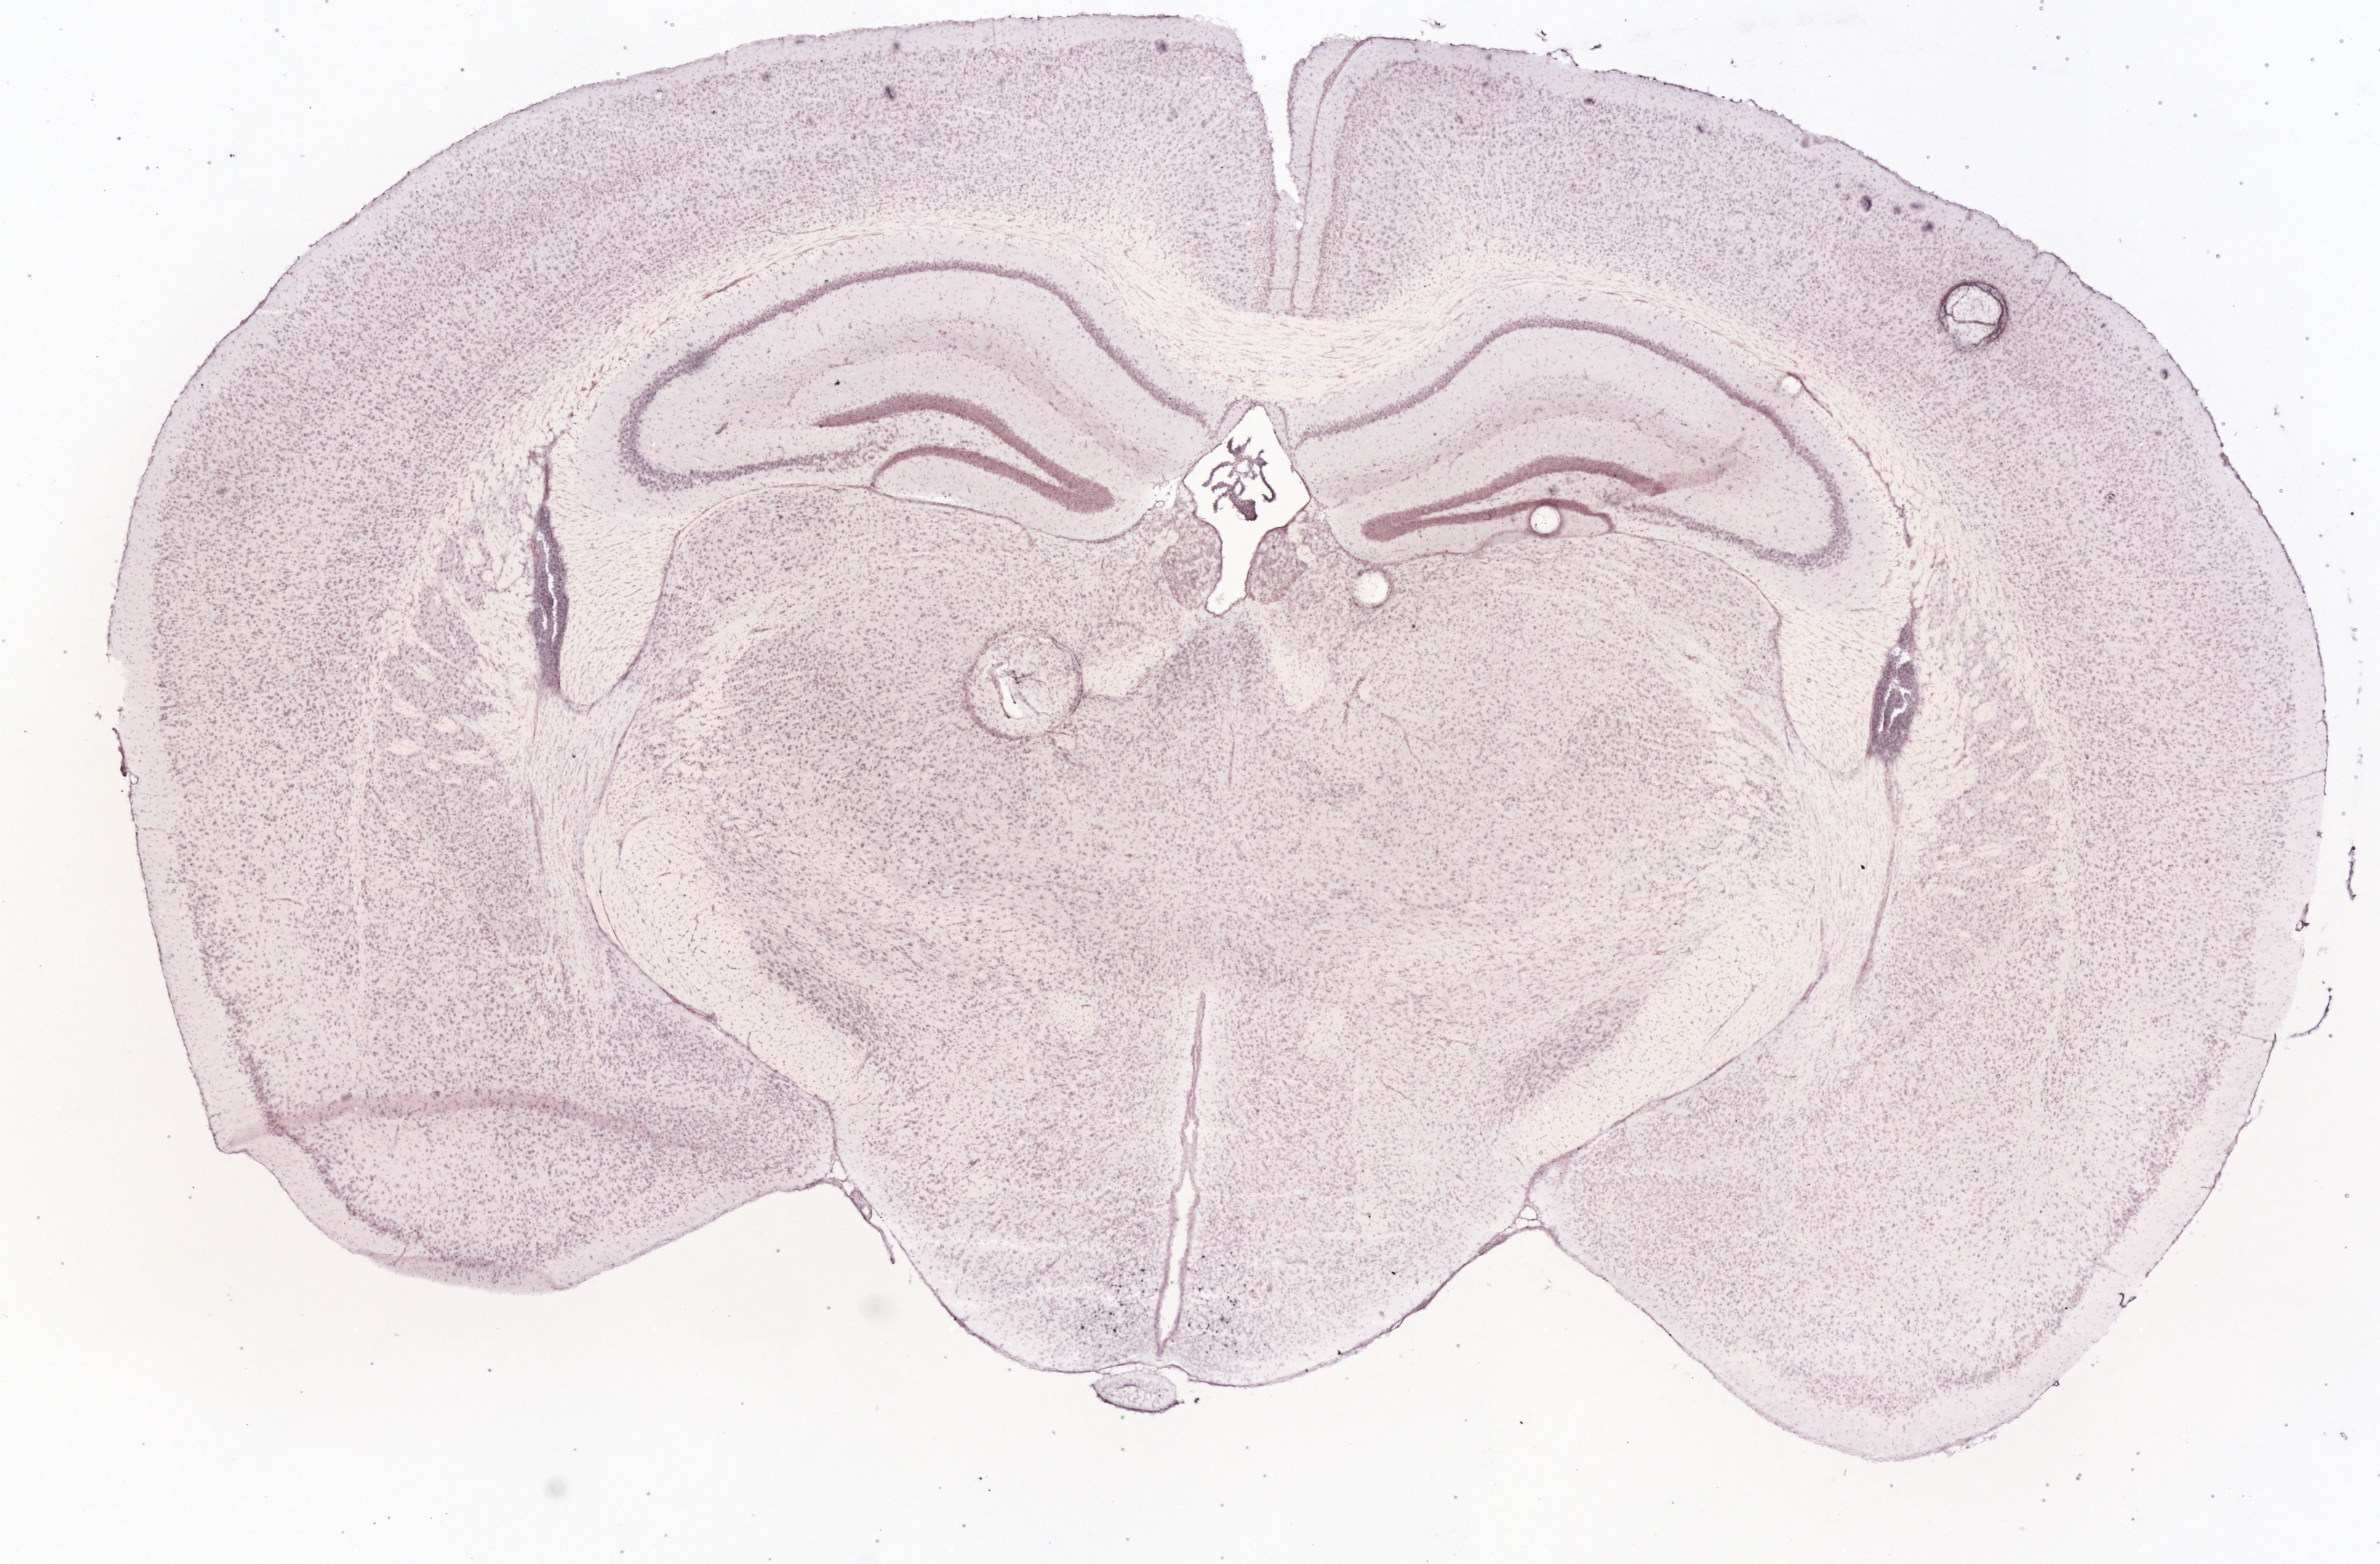
DIRECT ALLEN ISH
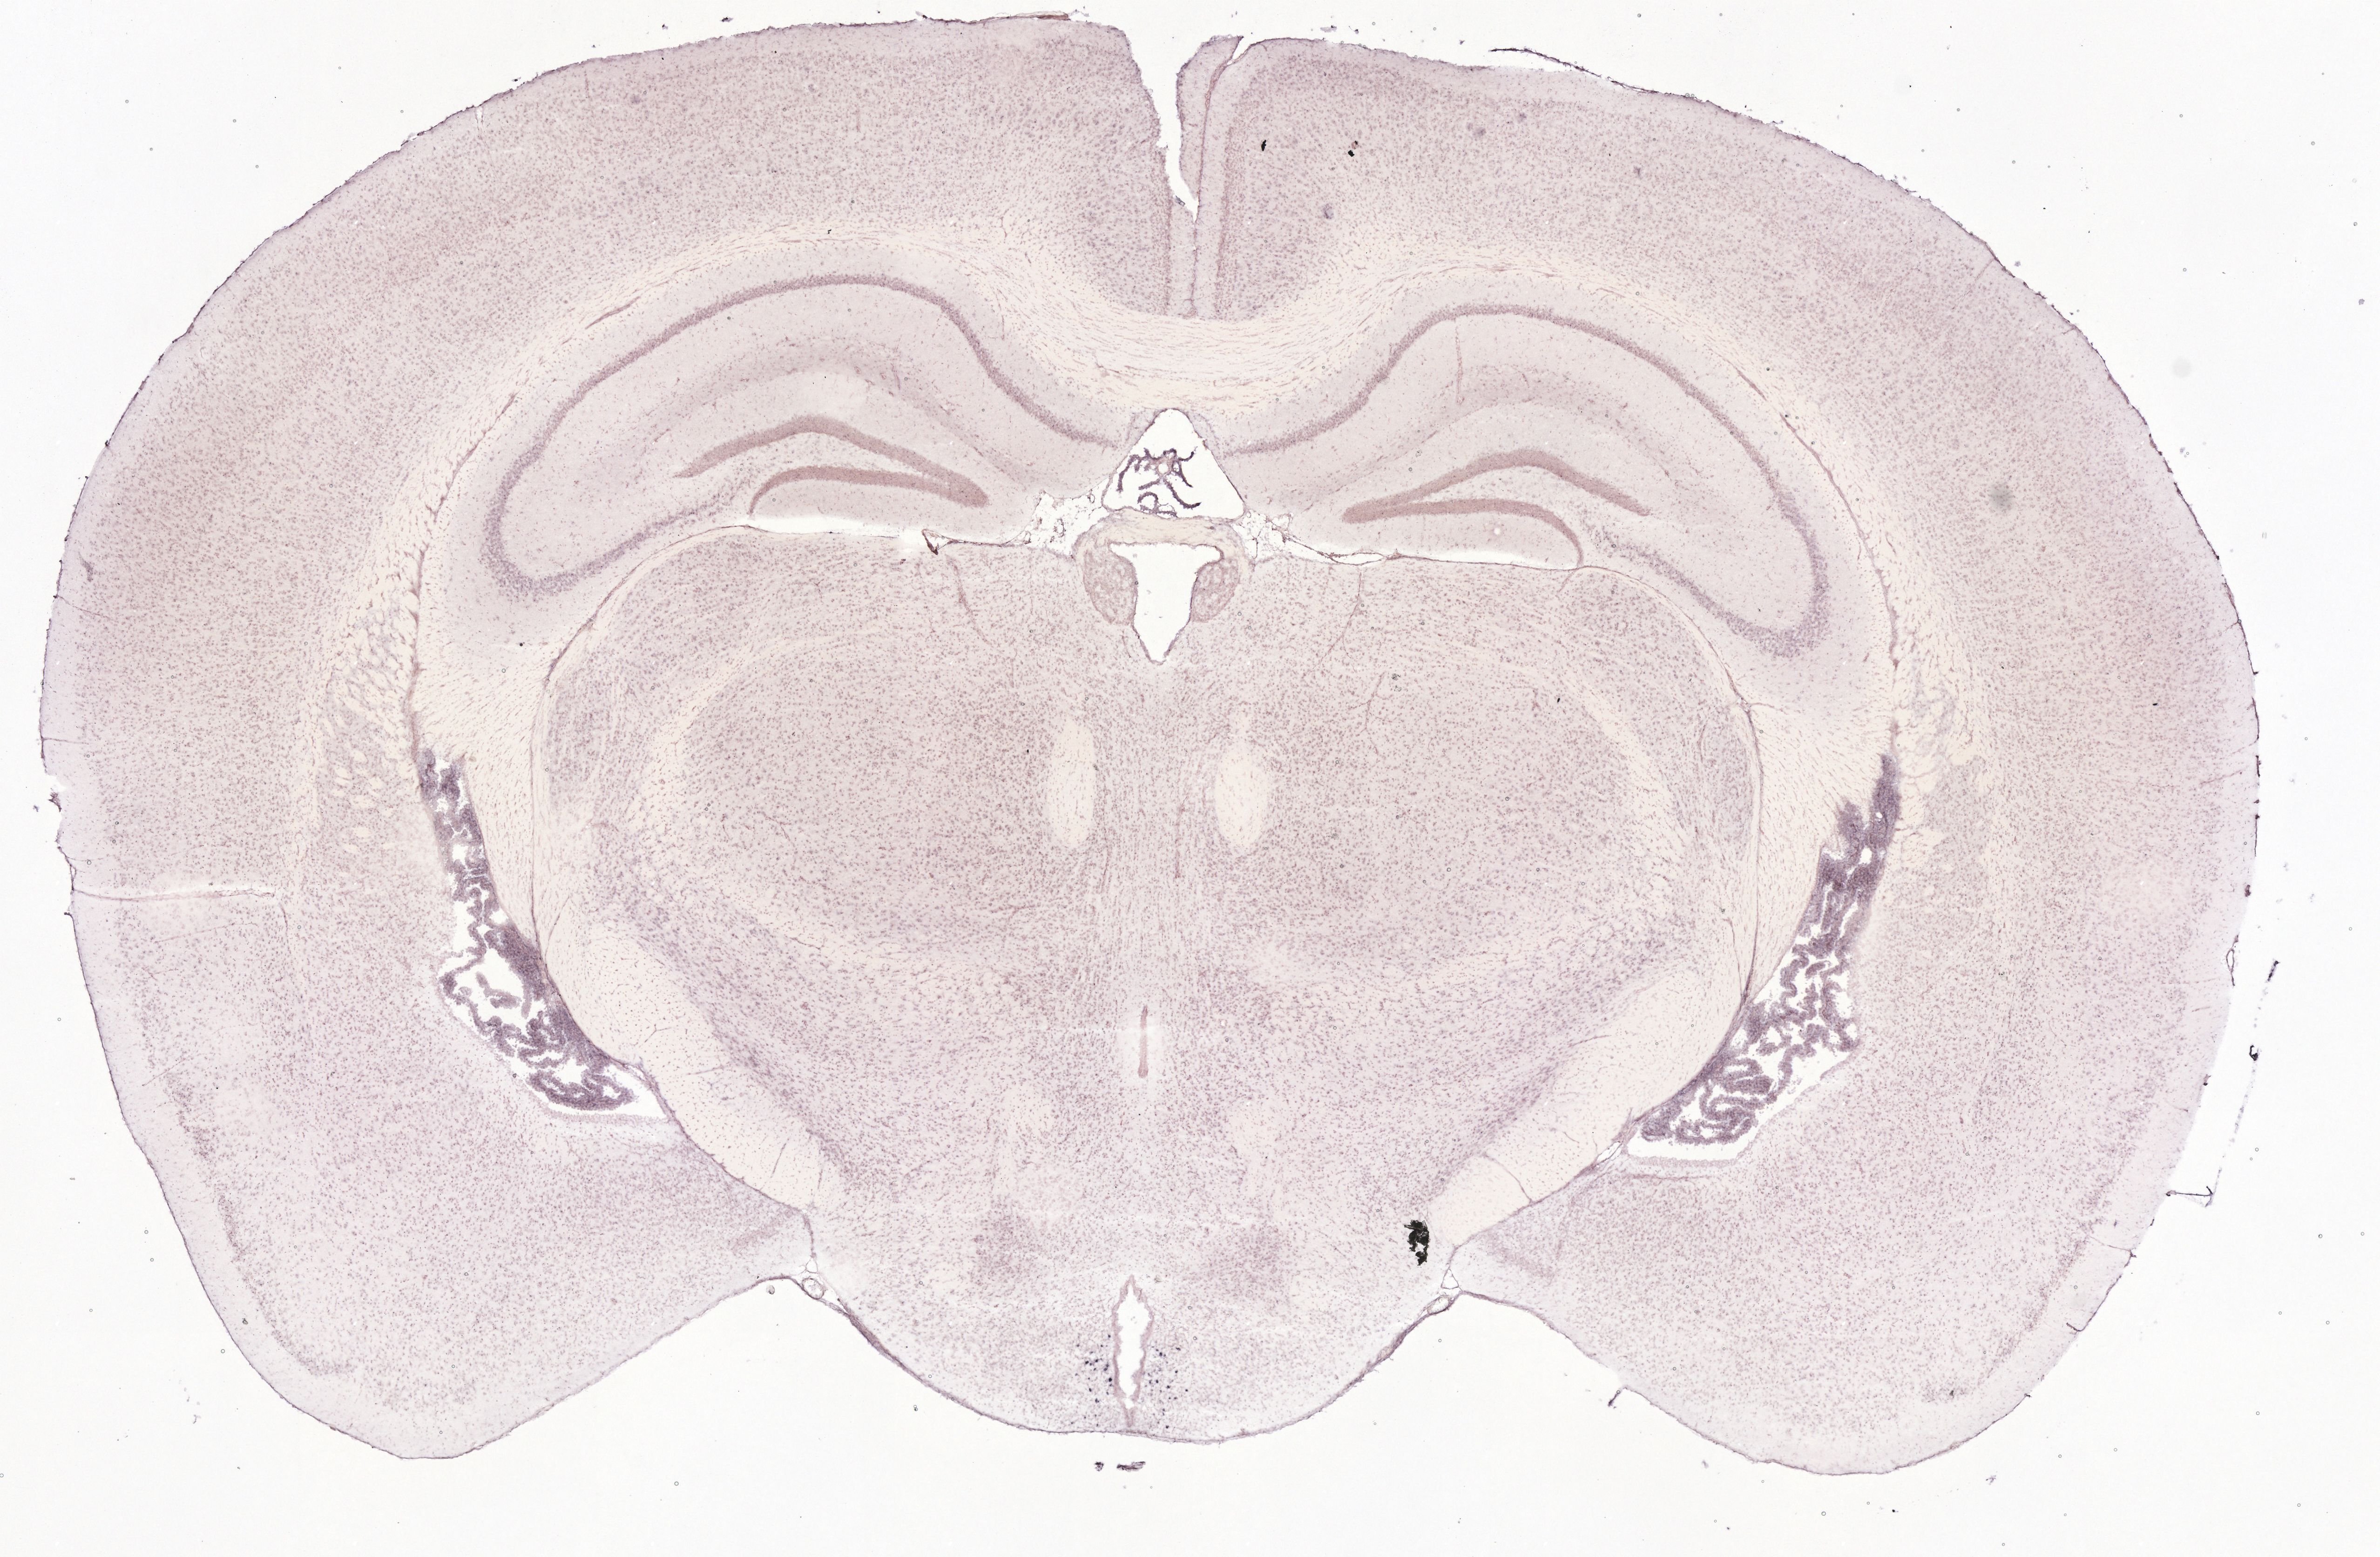
DIRECT ALLEN ISH
Regional expression figure
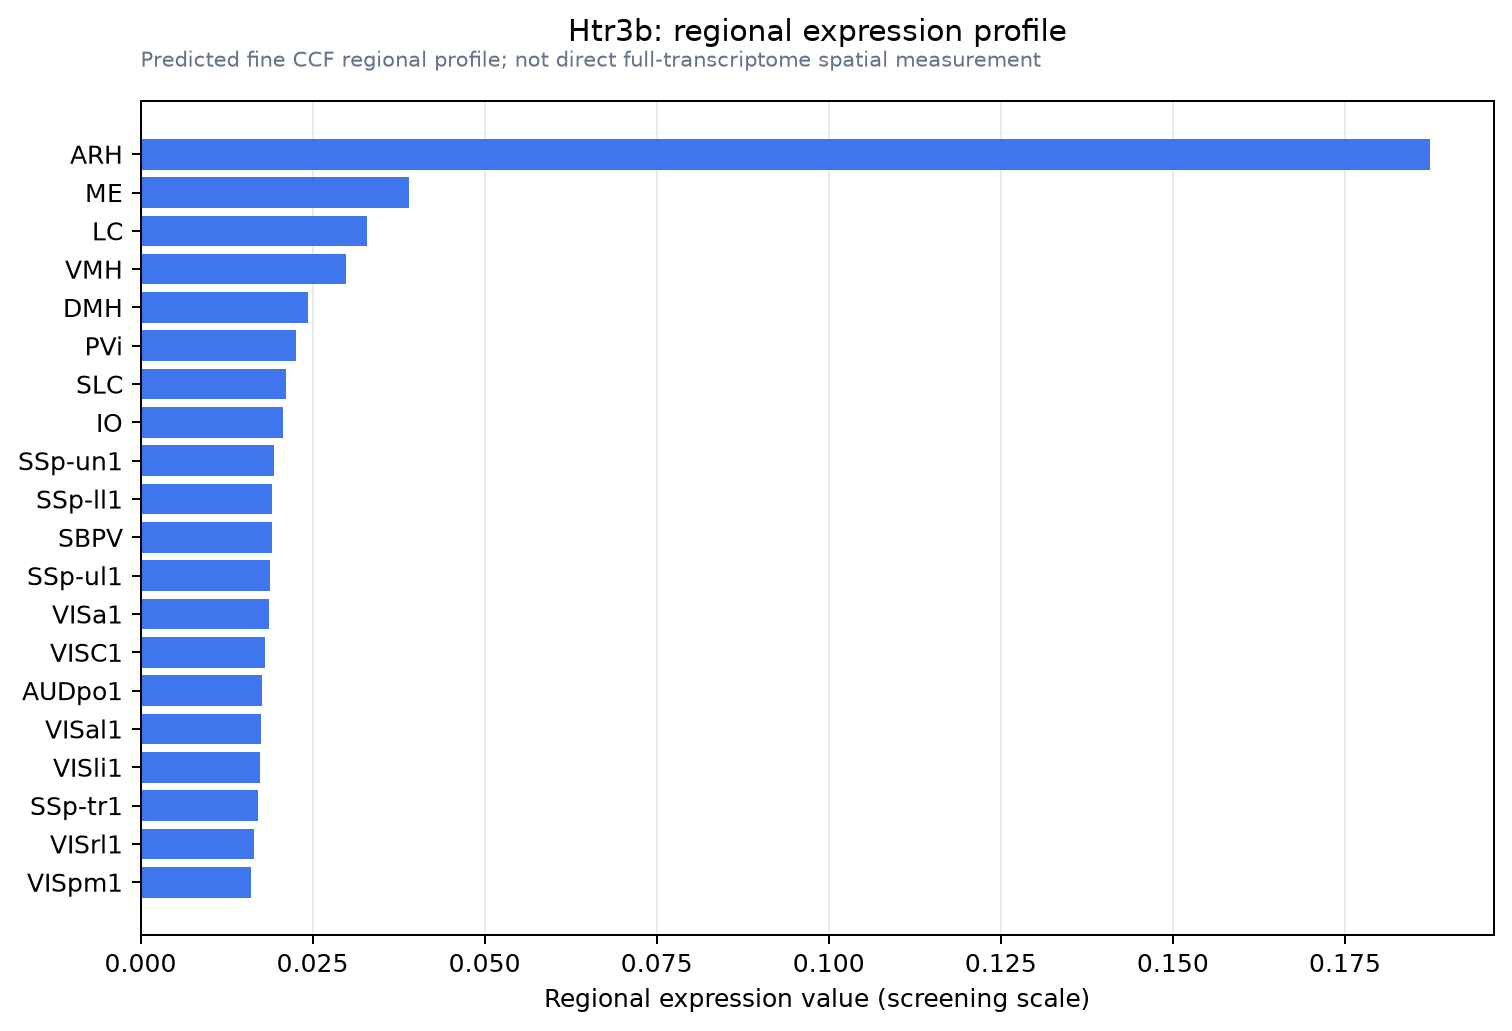
Predicted WMB × fine-CCF profile; not direct full-transcriptome spatial measurement.
Spatial profile
Evidence and specificity
- Evidence status
- PREDICTED_FINE
- Direct sources
- None; predicted localization only
- Exclusive threshold
- 12 positive regions out of 554
- Spatial specificity
- 0.359
- Top-region fraction
- 0.205
- Filter status
- PASS
Interpretation limits
- Cell-type-to-region projection is imputed expression, not direct spatial measurement.
- Adult reference atlases do not establish stability across age, sex, strain, state, or disease.
- Transcript abundance does not guarantee protein abundance or genetic-tool performance.