Chrna2
Neuronal acetylcholine receptor subunit alpha-2
Spatial tier: STRICT_EXCLUSIVE · Class: ION_CHANNEL · Top region: IPR (Interpeduncular nucleus, rostral) · Positive regions: 5/554
54.2Discovery Score
50.0Targetability Score
CEvidence grade C
What this means: Chrna2: predicted fine-region profile is strict-exclusive, with 5 positive regions out of 554 (limit 12); direct spatial validation is required.
Function in IPR: evidence, prediction, innovation
- Gene function
- Chrna2 encodes the alpha-2 subunit of neuronal nicotinic acetylcholine receptors, a ligand-gated cation channel subunit that assembles with beta subunits (mainly beta-2, also beta-4) into pentamers. Binding acetylcholine or nicotine opens a channel permeable to Na+, K+ and Ca2+, depolarizing the neuron and enhancing transmitter release. It is the most restricted alpha subunit in rodent brain.
- Region function
- The rostral interpeduncular subnucleus receives dense cholinergic and substance-P input from the medial habenula and, through GABAergic and glutamatergic output neurons, controls nicotine aversion, somatic withdrawal signs and anxiety-like states.
- Published in this region
- direct Chrna2 mRNA is most abundant in the IPN of all rodent brain regions, across subnuclei including the rostral part, with only scattered expression elsewhere (Lotfipour et al. 2013). The same study showed Chrna2 null mice have potentiated nicotine self-administration and altered withdrawal behaviour, and follow-up c-Fos mapping in alpha-2 null mice showed abnormal activity in IPN and connected midbrain/limbic regions during nicotine withdrawal, linking the IPN alpha-2 population directly to withdrawal expression.
- Predicted function
- Prediction: Alpha-2-containing nAChRs on IPR neurons convert habenular cholinergic drive into depolarization and Ca2+ influx, setting the threshold at which nicotine becomes aversive. IPN-restricted Chrna2 deletion should increase nicotine self-administration and blunt context-dependent somatic withdrawal; chemogenetic activation of Chrna2-positive IPR neurons should produce aversion and withdrawal-like signs, while silencing should be reinforcing at high nicotine doses.
- Innovation
- ★★☆☆☆ 2/5 Chrna2 is already tied functionally to the IPN and nicotine withdrawal, so remaining novelty lies in subnucleus- and cell-type-specific dissection of IPR.
- Tools
- Chrna2 knockout mice (Lotfipour et al. 2013), Chrna2-Cre driver lines crossed to Ai9 for reporter labelling, general nAChR antagonists mecamylamine and DHbetaE and agonists nicotine/cytisine (no alpha-2-selective small molecule exists), IPN-targeted AAV-Cre or AAV-DIO chemogenetics.
- References
Direct evidence located at the region
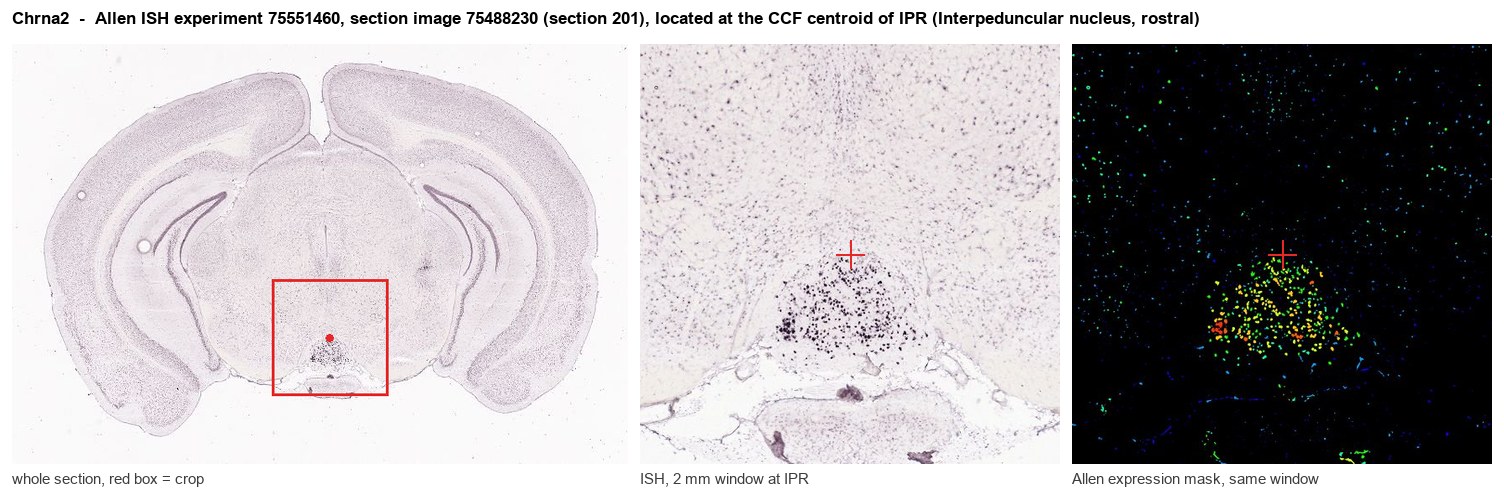
Allen ISH experiment 75551460, section image 75488230 (section 201): the section that contains the CCF centroid of Interpeduncular nucleus, rostral according to the Allen image-to-atlas alignment (reference_to_image), with a 2 mm window around that point. Left: whole section, red box = window. Middle: ISH signal. Right: Allen's expression-mask view of the same window. open this image in the Allen viewer
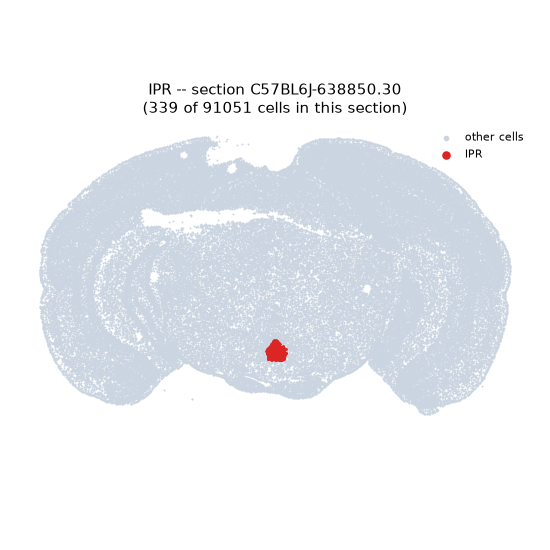
Look it up yourself: Allen Mouse Brain ISH for Chrna2Allen reference atlas: IPR (structure 607344834)ABC Atlas MERFISH viewer(in the ABC Atlas choose dataset MERFISH-C57BL6J-638850-CCF, colour cells by gene "Chrna2" or by parcellation_substructure "IPR")All genes confined to IPR + 3-D brain
Direct spatial evidence
MERFISH REGION LOCATOR
DIRECT ALLEN ISH
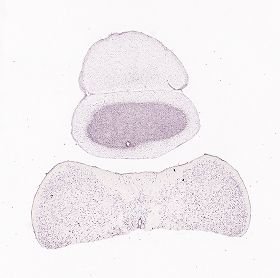
DIRECT ALLEN ISH
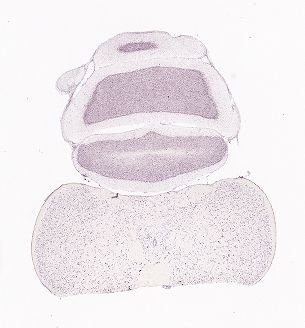
Regional expression figure
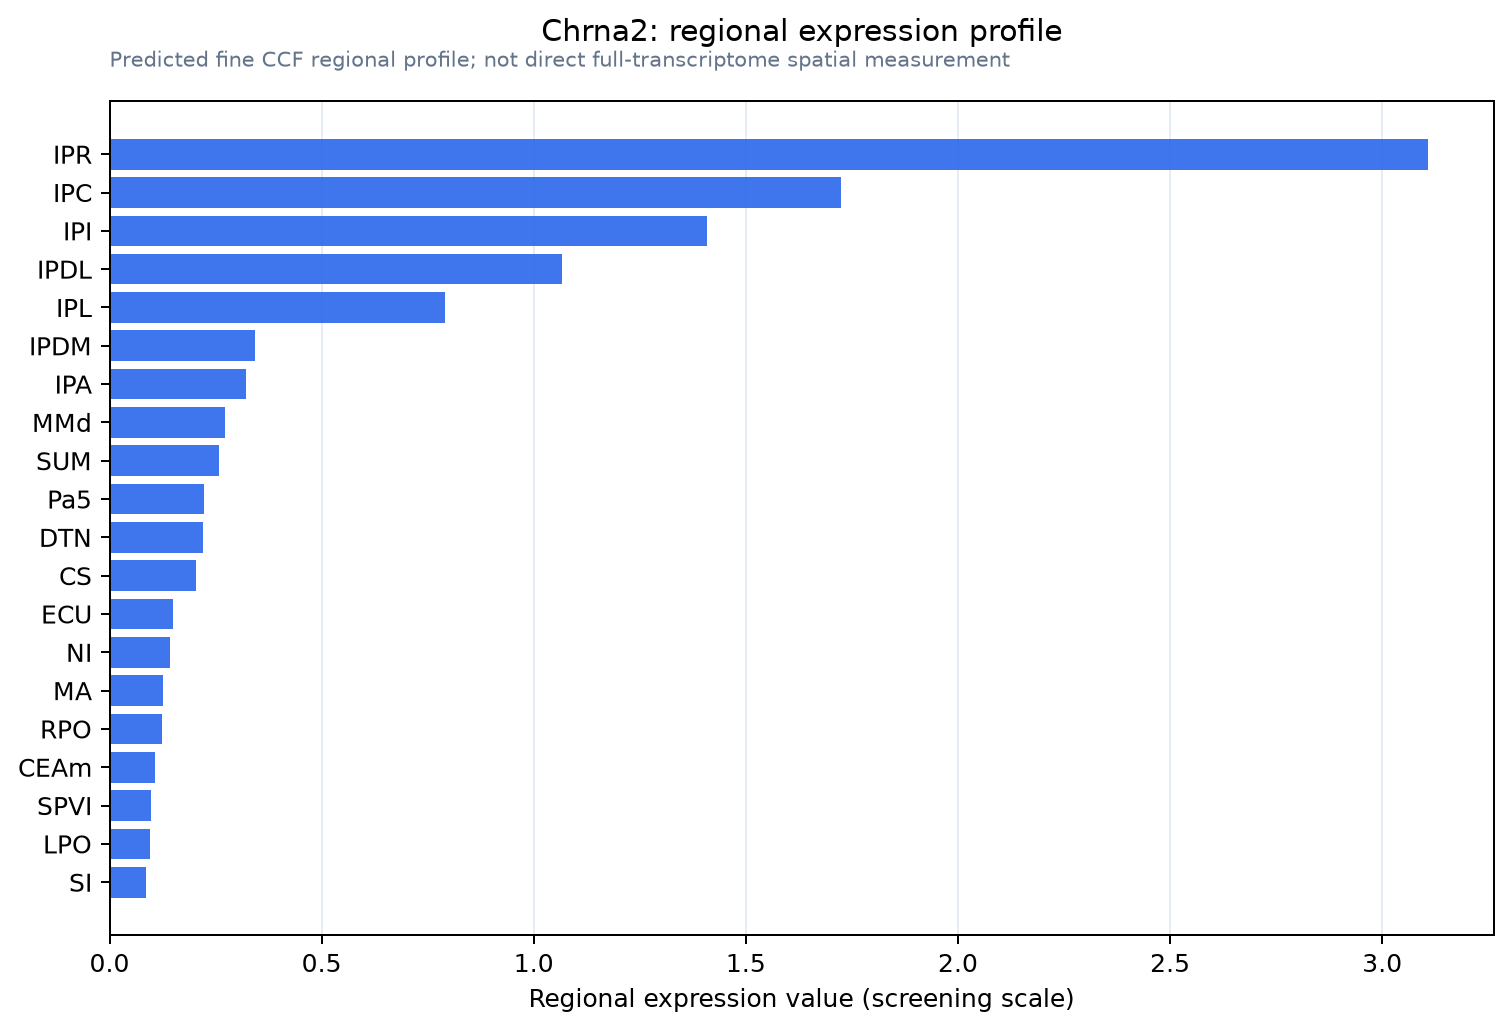
Predicted WMB × fine-CCF profile; not direct full-transcriptome spatial measurement.
Spatial profile
Evidence and specificity
- Evidence status
- PREDICTED_FINE
- Direct sources
- None; predicted localization only
- Exclusive threshold
- 12 positive regions out of 554
- Spatial specificity
- 0.525
- Top-region fraction
- 0.254
- Filter status
- PASS
Interpretation limits
- Cell-type-to-region projection is imputed expression, not direct spatial measurement.
- Adult reference atlases do not establish stability across age, sex, strain, state, or disease.
- Transcript abundance does not guarantee protein abundance or genetic-tool performance.